A simple, comparable read on how consistently teams are shipping in the open.
TL;DR
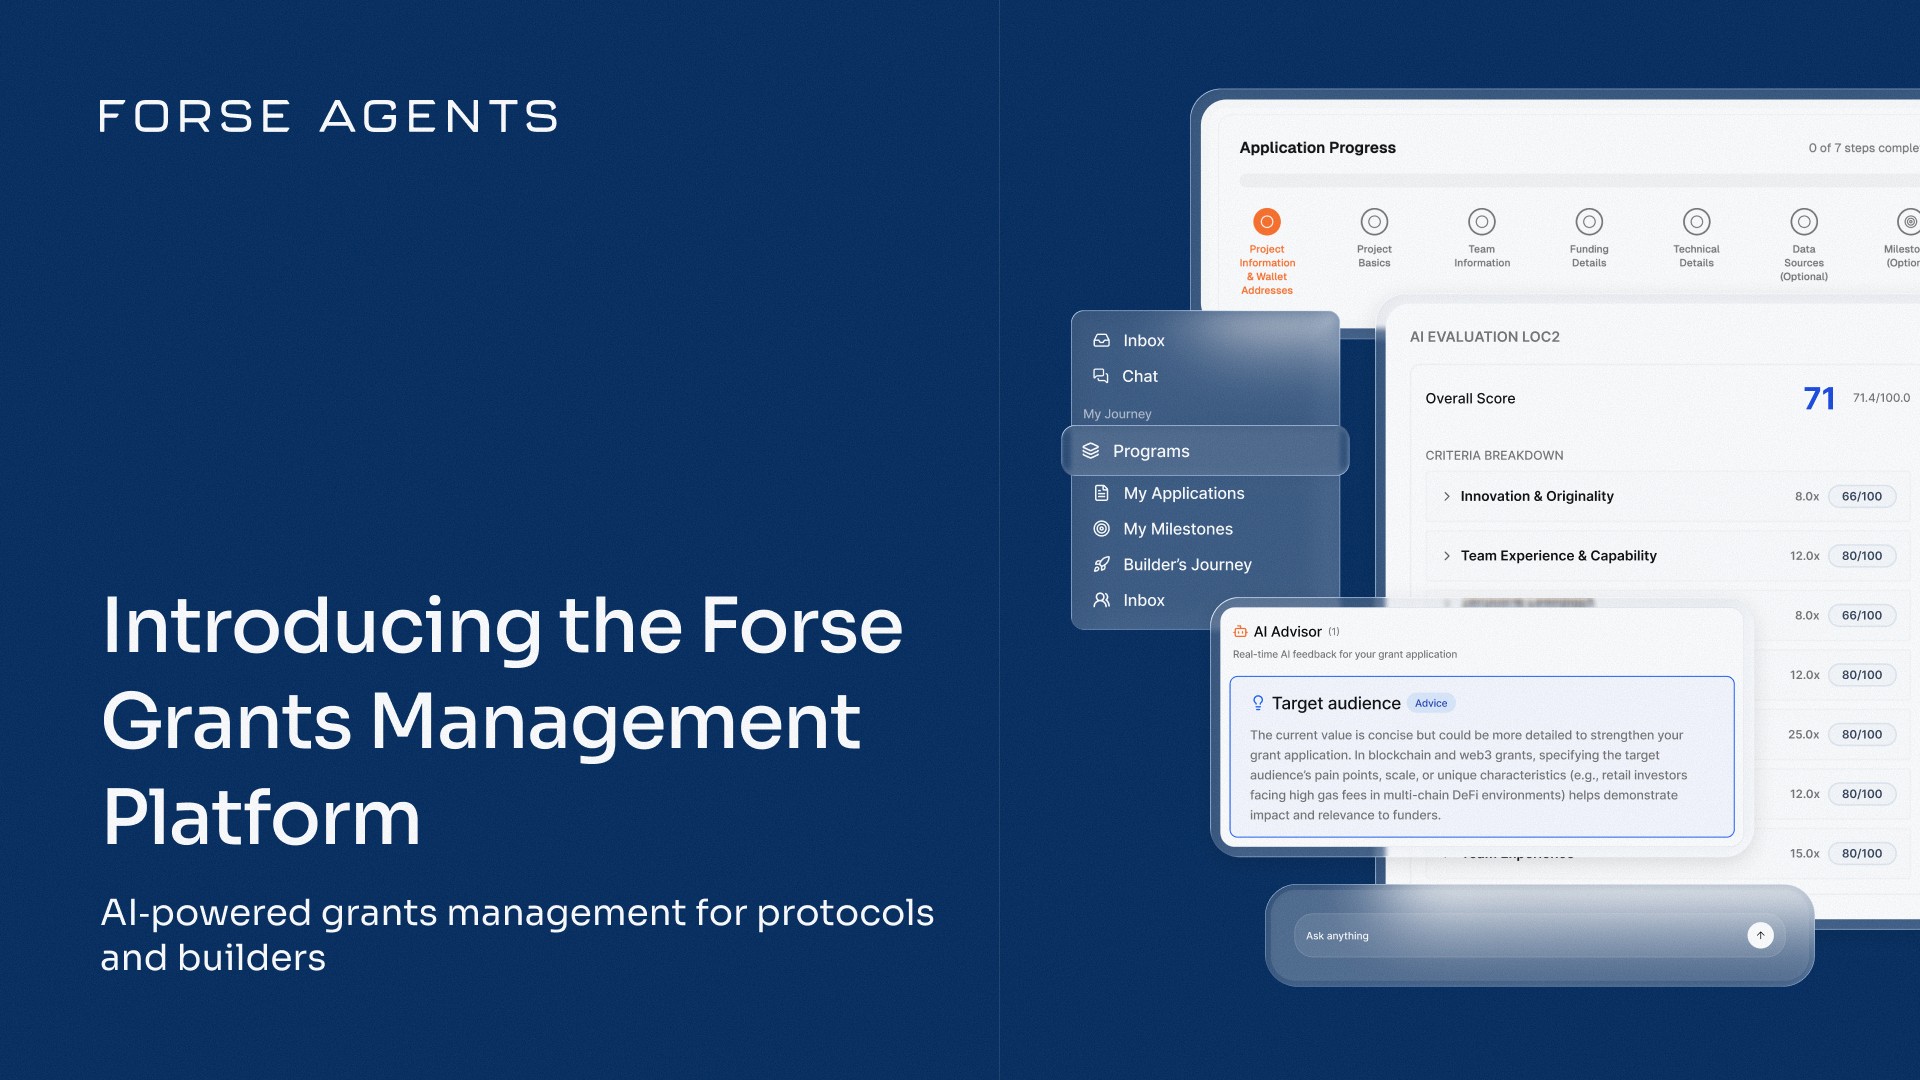
We developed a build‑side momentum index derived from public GitHub activity.
Surfaces momentum earlier than onchain metrics and milestone reviews.
Normalizes for team styles to enable fair, cross‑team comparisons.
Complements retention cohorts and ROI in program readouts.
Read on for the first of many Forse Work Highlights: what we built, how we built it, what we’re seeing, and how to apply it to your ecosystem.
Why It Matters
Programs need a dependable way to connect funding to follow-through. The GitHub Activity Index gives operators a timely read on whether energy is compounding, plateauing, or declining long before downstream usage settles. It verifies public shipping after milestone payouts, surfaces slowdowns early enough to intervene, and supports like-for-like comparisons without privileging any particular engineering style. Over longer arcs, it complements retention and ROI so leaders can see which investments keep working after the announcement moment. The index is especially relevant for web3 grants, where builders are funded and expected to deliver. It verifies public shipping and persistence after milestone payouts, flags early plateaus for timely check-ins, and pairs with retention and ROI to give foundations a comparable view of follow through across partners and rounds.
Context
Incentivizing innovation isn’t just about funding outcomes; it’s about understanding the effort and intent that drive them. Traditional reviews tend to measure what happened after the fact, which leaves a blind spot in the middle. Weeks or months can pass where teams are doing the work, but the signal is not formalized.
By tracking public development activity, we introduce an accountability lens focused on inputs teams fully control: their commitment to build in the open. This view applies across maturity stages. Early teams need a fair way to show progress before users arrive. Later teams need a way to demonstrate persistence after milestones are paid and press cycles fade.
What We Built
The GitHub Activity Index translates public development work into a transparent momentum signal. It is deliberately simple to interpret and durable across cohorts: track a weekly cadence, view a cumulative curve, and compare like‑for‑like across teams without privileging any particular commit style.
How It Works
Ingest: We monitor public repositories linked by participating teams, verifying ownership and relevance.
Normalize: We adjust for commit frequency, size, and repo mix to reduce style bias (e.g., many small commits vs. fewer, larger batches).
Weighting: Automated or trivial patterns are down‑weighted; sustained, human‑driven activity is emphasized.
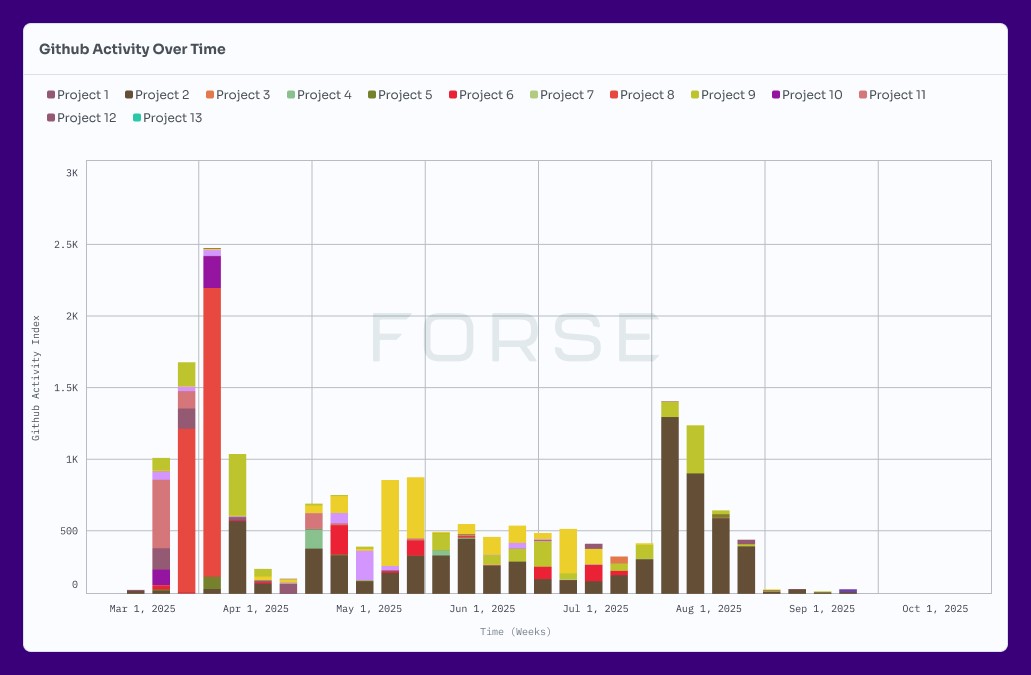
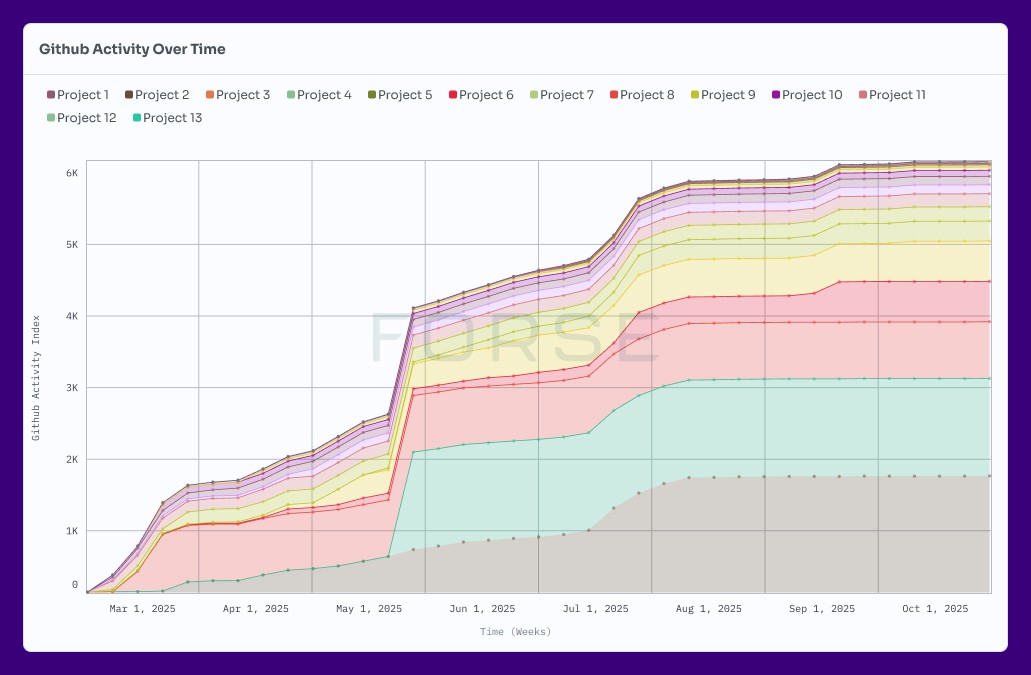
Series: We produce two views—weekly activity for rhythm and a cumulative series for persistence.
Smoothing: We apply light smoothing to mute minor noise while preserving real inflections.
Segmentation: Teams can be grouped by cohort, track, or phase to read momentum where it matters.
Together, these steps turn raw commit streams into a cleaner, comparable signal without overfitting to any one practice.
What We’re Seeing
Across monitored projects, the weekly rhythm shows a healthy mix of steady incremental commits and milestone‑based bursts. Some teams work in small daily slices, while others cluster work around releases. Both patterns can represent real progress when they persist week over week. The cumulative read tends to climb across the period observed, indicating sustained effort. Not every team maintains that slope. A minority show multi‑week pauses or taper after major deliverables. Those plateaus are visible in both the weekly and cumulative views and make for practical triggers. A short check‑in often clarifies whether the dip reflects a legitimate pause, such as testing, audits, or internal planning, or a loss of momentum. The relationship to usage is real but not one‑to‑one. Build activity frequently precedes key testnet and mainnet windows, which suggests that developer momentum leads deployment. Broader onchain behavior can trail by days to months, depending on category and market context. That is fine. The point is not to force correlation on short windows, but to give operators an early indicator that complements retention and ROI over longer arcs.
Caveats & Risks
The index focuses on what is visible: public, verifiable code contributions. Private repositories and non‑GitHub workstreams are not included, and some linked repositories may contain legacy or auxiliary code adjacent to the primary initiative. Teams that build in public are overrepresented relative to private‑only teams. The observation window also matters; longer views strengthen comparisons and improve downstream correlation work. As with any activity metric, gaming is possible. Trivial or automated commits can inflate raw counts, which is why normalization, down‑weighting, outlier checks, and smoothing are applied. Even so, this is not a game‑proof system. Program context and occasional code review should accompany the index, especially for edge cases.
Book a Forse Demo
Want this applied to your ecosystem? Request a demo or get started with Insights.
About Forse
Forse, built by StableLab, is the intelligence layer fueling web3 growth. It connects on‑chain, off‑chain, and proprietary data to measure what works and safely scale it. Composable analytics and context-aware agents maximize impact, accelerate execution, and compound results over time.
Share with your friends: