From messy data to live terminals
From the start, we knew data had to be one of our advantages at Forse. Not just having it, because everyone can access onchain data now, but turning it into something you can actually build product on.
Web3 data is also messy. Every new chain, protocol, or tool brings its own format and edge cases. Blockchains were meant to give us one neat standard, but in practice we now have many ways of almost‑standardising the same thing, plus all the messy edges that appear once protocols start doing anything interesting.
You can pull data from almost anywhere, but getting it into a shape that is reliable enough for a product is still a grind.
We pull from many places at once: raw network nodes, analytics platforms, token and price feeds, governance platforms such as Snapshot and Tally, and social data from tools like Discord.
Some of these sources already expose clean tables you can query and use in a terminal with very little extra work.
Others are the opposite. A network node might return a huge JSON blob with millions of transaction records and tens of fields when you only care about a handful.
Early on, our data analysts did what most teams do. They wrote one‑off scripts and notebooks, fetched from a source, cleaned and filtered the results, selected the fields that mattered, and saved everything to a table.
This works once. It does not scale when you support multiple partners and programmes, and when product needs live terminals instead of one‑off reports.
So we set a simple rule for ourselves: once we figure out how to clean and structure data from a given source, we should not have to solve that problem again.
We also knew that whatever we built had to be agent‑first. Every new pipeline and chart should be something a future Forse agent can understand, trust, and act on.
That is why we started building our own internal data pipelines and charting layer to enforce that rule. Today, that stack underpins our terminals. Internally, we call the pipeline framework Customizable Data Pipelines (CDP) and the charting layer Forse Graphic Layer (FGL).
The first part of that stack is our data pipelines.
CDP: making data cleanup easy
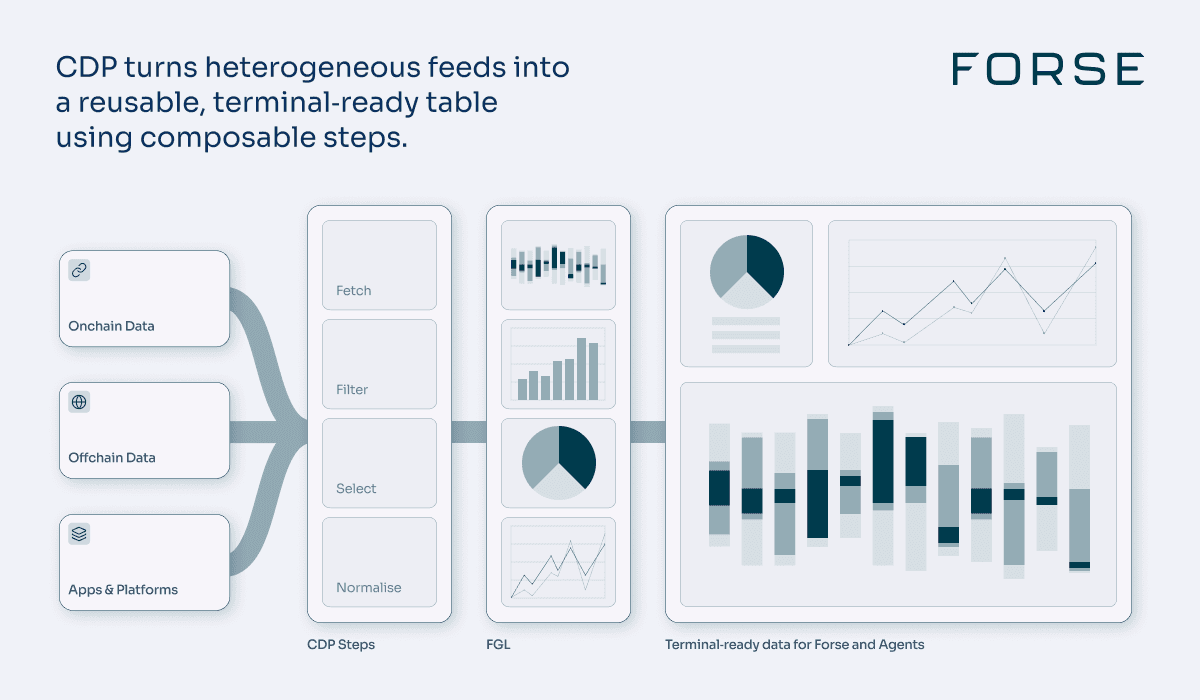
CDP is how we get from heterogeneous external sources to clean, reusable tables in our data warehouse.
It has two core ideas. Steps are small, composable functions that do one job, such as fetching from a source, filtering by time range, selecting columns, or transforming formats. Flows are ordered sequences of steps that take you from an external source to a prepared table.
For a clean source, a flow can be short. We can fetch a table, apply light filtering, and start analysing. For a messy source like a raw node, the flow is longer and more technical. A typical pattern looks like this:
Fetch a large JSON with millions of records.
Filter down to a specific time window.
Keep only contract calls we care about.
Select a small set of fields.
Normalise formats so we can compare and aggregate later.
Once we encode this work as a CDP flow, we do not want to resolve that specific problem again. The same set of steps can be reused next month or for a different project that needs the same cleaned data.
Over time, CDP has become a library of reusable steps and destinations, expressed mostly in configuration rather than code. A typical flow specification answers three questions: which steps should run and in what order, where the flow should read from and write to, and which parameters each step should receive.
CDP is our way of making that level of reliability and repeatability available for the kind of growth, capital, and ecosystem data we care about at Forse.
Once we have clean data, we still need a way to turn them into charts and terminals.
FGL: from tables to charts
Forse Graphic Layer (FGL) is our internal charting layer that links prepared data to the visuals you see in Forse.
FGL sits between the prepared data and the front end. Its job is to describe what each chart should look like and how it should behave, without duplicating or hard‑coding logic in the application.
We made a simple architectural choice that has a large impact. We keep two separate databases: one holds the prepared data we want to show, and a separate database holds the graph configurations.
A graph configuration contains everything about how a chart should look and behave:
The chart type, such as bar, line, area, or heatmap.
Which table and fields to read from.
Labels, axes, units, and date formats.
Interaction parameters such as scrollable heatmaps, interactive legends, and line thickness.
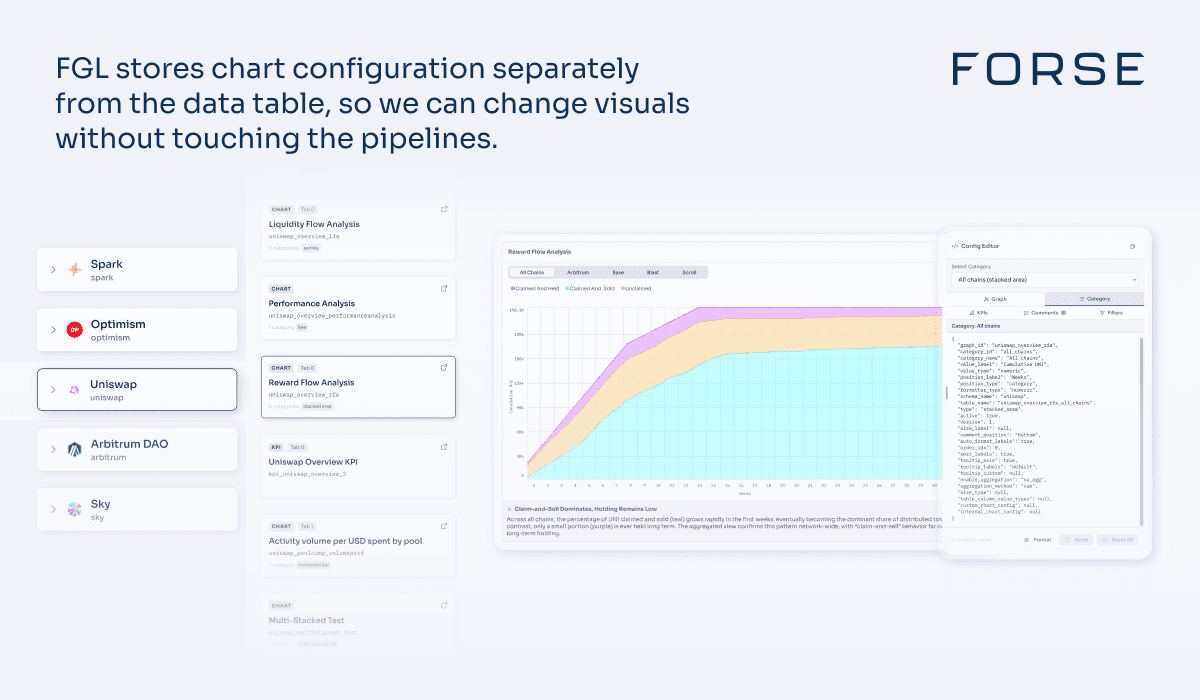
You can think of FGL as a configurable "chart server". The analyst prepares a table using CDP or manual analysis. FGL knows how each chart type expects the data to be shaped. If the input is almost right but not perfect, FGL can refit it into the exact shape the chart expects.
This separation of concerns lets product and design iterate on visuals without touching the underlying data tables. It lets data teams work on correctness and coverage without worrying about breaking charts. A single table can power multiple charts with different configurations.
When you open a terminal in Forse Insights, what you see is the combination of a clean table produced by CDP or an analyst, a FGL configuration that defines how to turn that table into a chart, and our front‑end graph library that renders it in the browser.
Together, CDP and FGL give us a repeatable path from raw feeds to live terminals.
Why we built it this way
From a product and engineering perspective, there were a few reasons to invest in CDP and FGL instead of relying only on off‑the‑shelf tools.
We are treating data as a long‑term asset. We combine onchain signals, offchain activity, and proprietary datasets in the same stack, so it made more sense to build durable infrastructure now than to rebuild one‑off integrations later.
We need live, trustworthy terminals instead of static dashboards. Teams want to see what is happening now, not what happened last month.
Our data sources are too heterogeneous for a single generic tool. Onchain nodes, governance platforms, offchain APIs, and community tools do not always fit cleanly into standard ETL and BI tools.
We want to keep the team focused on the highest‑leverage work. Automation is how we support multiple partners and programmes without turning every new integration into a bespoke project.
In short, CDP and FGL let us invest once in data infrastructure and benefit many times over. They speed up delivery today, reduce maintenance tomorrow, and give us a solid foundation for the agent and AI workflows we are building on top.
Since rolling out CDP and FGL internally, our data team estimates that going from a new data source to a stable, terminal‑ready table is roughly 10× faster than with our previous one‑off scripts and charts. For partners, that means new metrics and terminals go live much sooner, and existing views stay accurate without needing constant rebuilds.
If you have worked with CI/CD for code, the idea will feel familiar. CDP handles the integration side: raw data comes in from a node, an API, or another platform, and a predefined pipeline cleans it, filters out noise, validates the structure, and lands it in a table. FGL handles the delivery side: it takes those clean tables and turns them into the charts and terminals that people see.
Together, they give us for data what CI/CD gives engineering teams for code: new inputs flow in, terminals update automatically, and we can evolve the system without breaking it.
Over time, this stack also becomes the context layer for our agents and AI systems. Because CDP and FGL define how data is cleaned, structured, and visualised, agents can rely on consistent tables and configurations instead of scraping charts or re‑implementing logic. That is what lets us move from human‑driven analysis to automated monitoring, alerting, and eventually agent‑driven workflows.
Why it matters and what’s next
For partners, this means:
They can plug in their preferred sources and systems, and still get a coherent terminal experience.
Terminals stay fresh because flows are scheduled, not rebuilt from scratch every time.
For Forse, it means:
Shorter time from "we should track this" to "there is a live terminal showing it".
Less risk of regressions when we adjust metrics or visuals because data and charts are separated.
Better performance over time, as we optimise how we store, query, and render the same shared datasets.
A clearer path to connecting these insights into Forse Agents workflows.
Next, we are focusing on expanding the library of reusable CDP steps, adding more chart primitives and interactions to FGL, and tightening the integration between terminals and agents so the same clean data that powers a chart can also power automated followups.
The end goal is simple. If someone on the team can define what a good decision requires, Forse should be able to make the relevant data and visuals appear, live, with as little manual work as possible. CDP and FGL are the foundation that makes that possible.
Share with your friends: